Dr. Bill Conerly is the principal of Conerly Consulting LLC, which
helps business leaders make more profitable decisions through a better
understanding of the economy. In his monthly newsletters, Bill shows some great graphs. When it comes to economics, a picture really is worth a thousand words!
What I like about Bill is that he jots his simple interpretation right next to each one. The first set of graphs is for the Pacific Northwest, where he and I both live. The second set is the U.S.
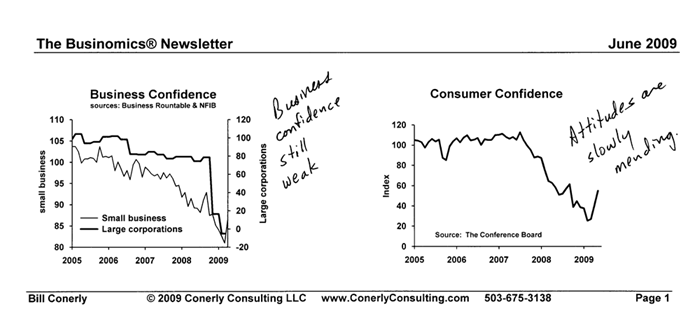
Here is a sample of just two of his charts from June 2009. Click to enlarge: When you enlarge the picture from June 2009, note the large corporation pessimism has finally caught up to that of small business. Small business is leading the way again. I wonder if we’ll lead the way up, too.
His charts cover:
- Net new jobs…still losing jobs but at a milder pace.
- Consumer confidence…attitudes are slowly mending.
- Consumer spending…now level rather than dropping sharply.
- Business confidence…still weak.
- Capital Goods orders…spending still weak.
- Non-residential construction…an uptick, but the gains were in factory and utility plant which were probably planned long ago.
- Ted spread (3 month LIBOR minus T-bills)…Risk premiums are falling; very good news.
- Stock market…a little rally.
Take a look at all this month’s graphs yourself. I like Bill’s plain-English take on things and the charts that show the story. If you want to keep up with Bill and his economic insights, subscribe to his newsletter.
He also works for banks preparing economic forecasts for your area and sharing it with you and your business clients. That could be a good use of your bank’s marketing dollars right about now.
